Profiling - the Good Kind
Gradle configuration phase
being slow is a common complaint from Gradle users. This phase today is largely
a single-thread operation that gets linearly slower as the number of projects
in settings.gradle grows.
Time spent in configuration phase can be effectively mitigated by adopting configuration caching to make it skip the cost of configuration for anything that has been run before. You should really be adopting this feature if you haven’t done so yet!
Sadly, first runs (CI in particular) and Gradle sync in Android Studio do not get better with configuration caching and require a more painful analysis and optimization. This post will talk about how to approach it.
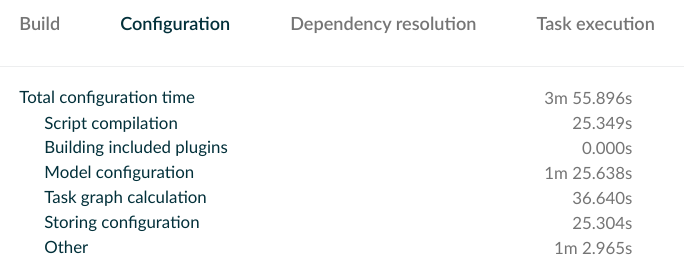
Gradle Build Scans can help you here to see the trends of configuration time to get a higher level idea. Sadly, build scans fall short on any sort of meaningful analysis of configuration time.
Here is an example of a scan from an AndroidX CI runner
Turns out the good old JVM profilers are the actually the best thing to do this analysis and Gradle created the Gradle Profiler to make it easier to automate capturing a trace. Gradle Profiler README.md is a great place to start on how to use this tool. It will let you choose what JVM profiler you want to use, what tasks do you want to run, and what other type of set up should be used for this trace. For example, in AndroidX we wanted to optimize configuration time for a common set of tasks invoked by CI and to use Yourkit profiler to do the trace capturing. Our scenario file looked like:
default-scenarios = ["buildOnServer"]
buildOnServer {
    title = "buildOnServer"
    tasks = ["buildOnServer", "checkExternalLicenses", "listTaskOutputs", "validateProperties"]
    gradle-args = ["--dry-run", "-Pandroidx.allWarningsAsErrors", "--no-configuration-cache"]
}
and the command was:
LD_LIBRARY_PATH=$LD_LIBRARY_PATH:~/path/to/yourkit/bin/linux-x86-64/ \
  YOURKIT_HOME=/path/to/yourkit \
  JAVA_HOME=/path/to/jdk \
  ./build/install/gradle-profiler/bin/gradle-profiler --profile yourkit \
  --no-daemon \
  --project-dir /path/to/project \
  --scenario-file dryrun.scenarios
Running this will produce a trace that you can then view in your JVM profiler
to do the analysis similar to any other JVM process focusing on the main thread.
Here is an example of a flame graph from a trace for an AndroidX project
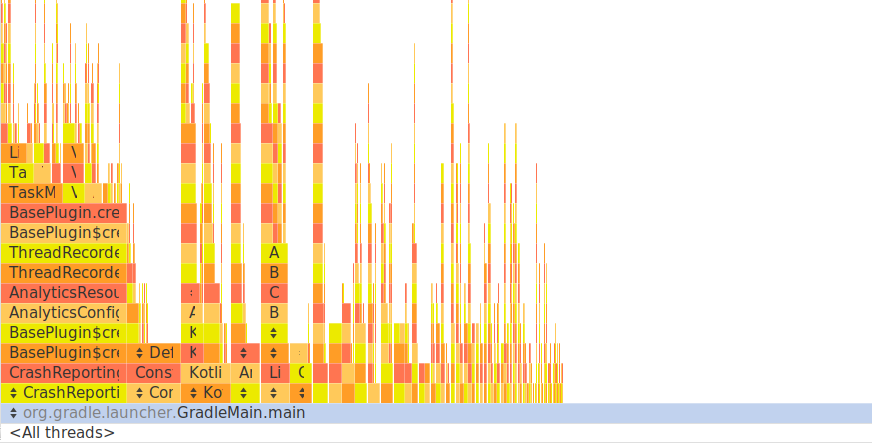
This gets you the data, but not how to interpret it. I intend to write a follow-up post on what to look for in these traces.