The Catch in Using Exceptions for Control Flow
Continuing my series of posts about profiling Gradle, I’d like to share how I found a shortcoming in Gradle that was costing androidx configuration phase to be 110 seconds slower than needed.
It all started with an observation that Gradle would be seemingly stuck when
it got to 100% CONFIGURING [Xm Ys].
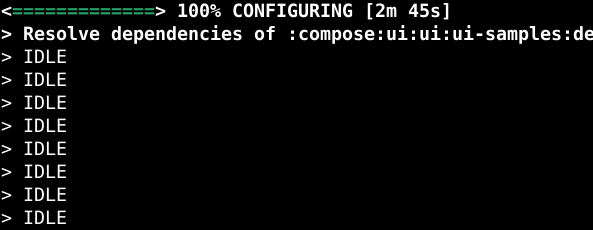
The time continued to update, but nothing seemed to be happening. To investigate
I started looking at what is happening using a profiler. As it was recording
I was paging through and stopped at Exceptions tab, spotting this:
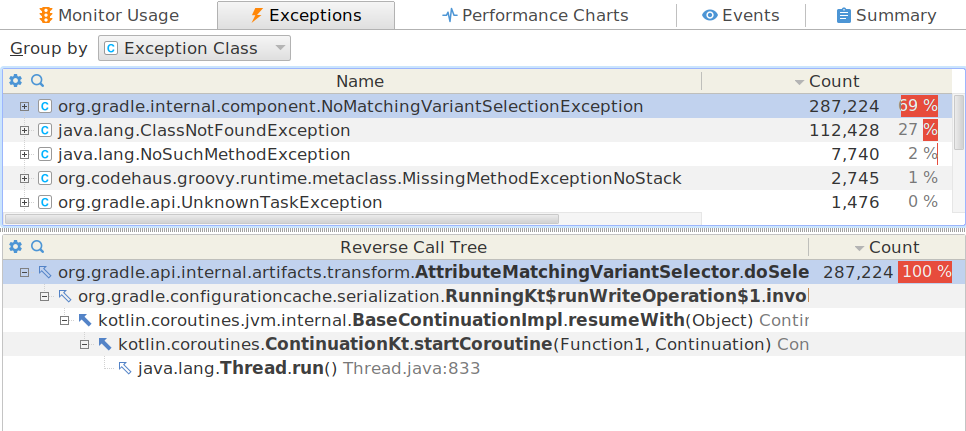
Narrator: that surely seems like a lot of NoMatchingVariantSelectionException exceptions.
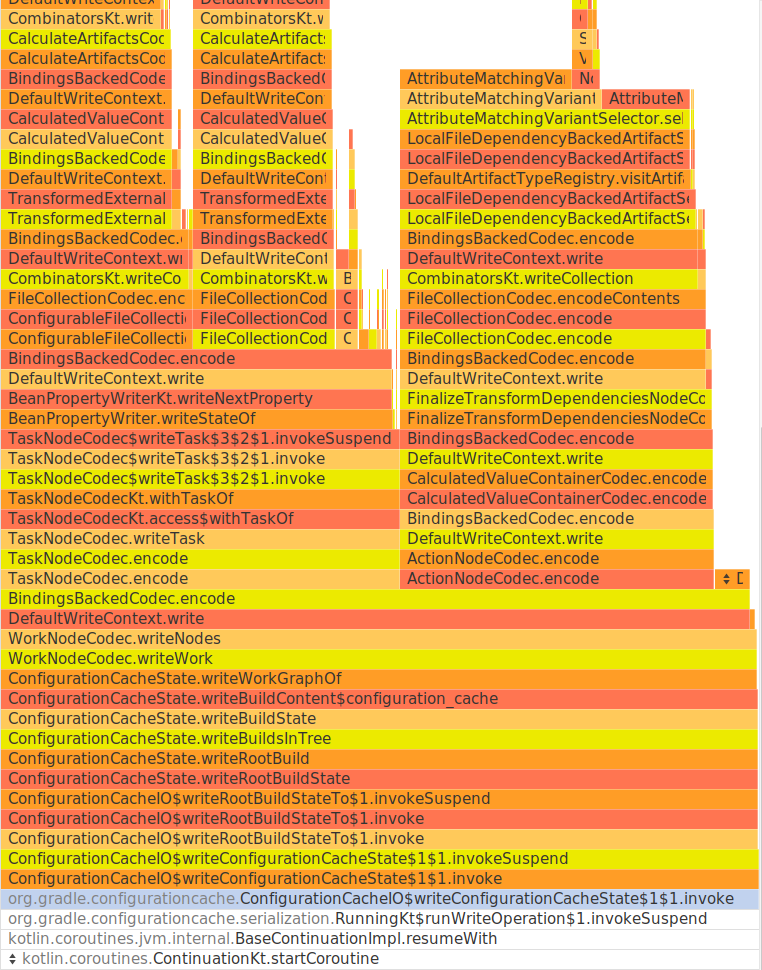
Going through the timeline, this is the Gradle code that was running when in
100% CONFIGURING state.
AndroidX does use configuration caching feature, so it is not surprising that
we need to serialize it, but looking at configuration-cache/*/work.bin it is
only 387MB, so spending 136 seconds writing that out feels excessive.
Digging through this stack, it can be seen that we are spending about
103 seconds in AttributeMatchingVariantSelector. Then I remembered seeing
287K NoMatchingVariantSelectionException and the stacks for those matched
up. Turns out Gradle was using exceptions for control flow. In AndroidX
we hit this code path a lot so had to create 287K of them and that’s not fast
even on a desktop.
I created an issue report to Gradle and within couple days they landed a fix. It will ship in Gradle 8.1. Testing out the fixed version with AndroidX resulted in configuration cache serialization going from 136 to 22 seconds while also making the memory usage lower.
I hope this is enough of a motivation for you to also profile your builds and help me improve the whole ecosystem.
As a side note, I also created a feature request for Gradle to show the configuration serialization step in CLI so hopefully such issues would become easier to spot in the future.