Benchmark, Profile, Trace - What's the difference?
For the longest time benchmarking, profiling, and tracing seemed like synonyms to me. I didn’t have an appreciation for what each technique is and when it should be used. I would like to help you fix that.
Benchmarking is a technique that allows you to get a sense how long a given operation takes under the defined conditions. Generally, a single benchmark measures the time of single operation that is run many times, discarding initial few runs as often there are caches/slow paths involved in these runs. The environment is set up to make results as realistic and as consistent as possible, for example benchmark might lock the operating frequency of your CPU to avoid noise from CPU governor. As long as the environment is representative of your users, the absolute value of the benchmark result is an accurate representation of time spent. Benchmarks are great to measure the effects of your changes.
Profiling is also a technique for getting a sense on how long an operation is taking, but instead of the coarse view you want to see the time taken by different parts of your operation. This view can help you identify slow work. Similar to benchmarking the environment is set up to make the results as reproducible and representative as possible. To profile an operation you use a profiler tool (e.g. yourkit or async-profiler) that injects itself into the execution of your operation. Due to the nature of how profilers work by modifying the runtime the absolute measured time is not representative to your users, but I can help you find slow parts of your code to improve. It is important to use benchmarks to validate your fixes instead of relying on profiler runs to make sure you measure real improvements.
Tracing is the most similar to profiling and also focuses on the granular view of your operation. Unlike profiles that treat your application largely like a blackbox, tracing uses a very low overhead library that the creator of the code uses to mark interesting parts of their code. The big benefit is that it makes the performance with tracing enabled representative to your users at a cost of manually having to identify important parts of your code to trace. Profilers do not require you to do this work and can be easier to get started.
To get tracing in an Android application, you can use androidx.tracing.Trace:
Trace.beginSection("importantWork")
Trace.beginSection("workA")
workA()
Trace.endSection()
Trace.beginSection("workB")
workB()
Trace.endSection()
Trace.endSection()
or the new work-in-progress API androidx.tracing.TraceDriver that works both on Android and JVM:
val driver = createTraceDriver()
driver.use {
    driver.tracer.trace(category = CATEGORY_MAIN, name = "importantWork") {
        driver.tracer.trace(category = CATEGORY_MAIN, name = "workA") {
            workA()
        }
        driver.tracer.trace(category = CATEGORY_MAIN, name = "workB") {
            workB()
        }
    }
}
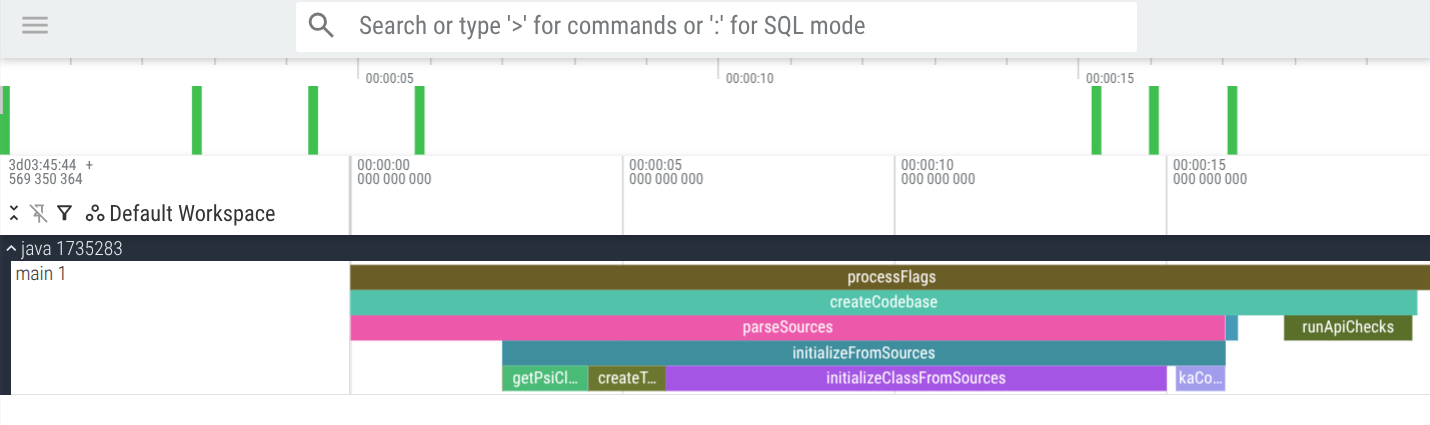
which then can be viewed in your browser on ui.perfetto.dev
Here is an example trace from our API tracking tool Metalava that runs on a JVM
All of these techniques are very helpful and can often be used in tandem. Tracing is often the most overlooked and can be amazing for investigating issues in your production applications.