org.gradle.internal.operations.trace
Sometimes I find it fun to look into internal tools of large projects. I want to share about an internal Gradle tracing feature that is very neat, but also could disappear tomorrow as it is internal. This tool is similar to Gradle Build Scans that you might have used for your projects. However, this focuses on much more granular view of what happens within your Gradle invocation. Gradle team uses this feature to optimize the Gradle tool itself.
Note: this was tested on Gradle 8.14.3 and 9.3.0 and might not work on older or newer versions.
To illustrate what this looks like, let’s look at nowinandroid project. In
that project, we can build the app with a few additional arguments:
./gradlew app:assembleDebug -Dorg.gradle.internal.operations.trace=$PWD/trace1
Once this invocation ends, you’ll get trace1-log.txt in the root directory of our project. This file is not really
human-readable, so Gradle maintains gradle-trace-converter tool that
converts it to perfetto trace. After you build Gradle trace converter (gtc), you can run:
gtc trace1-log.txt
This will produce trace1-chrome.proto that you can be view in ui.perfetto.dev.
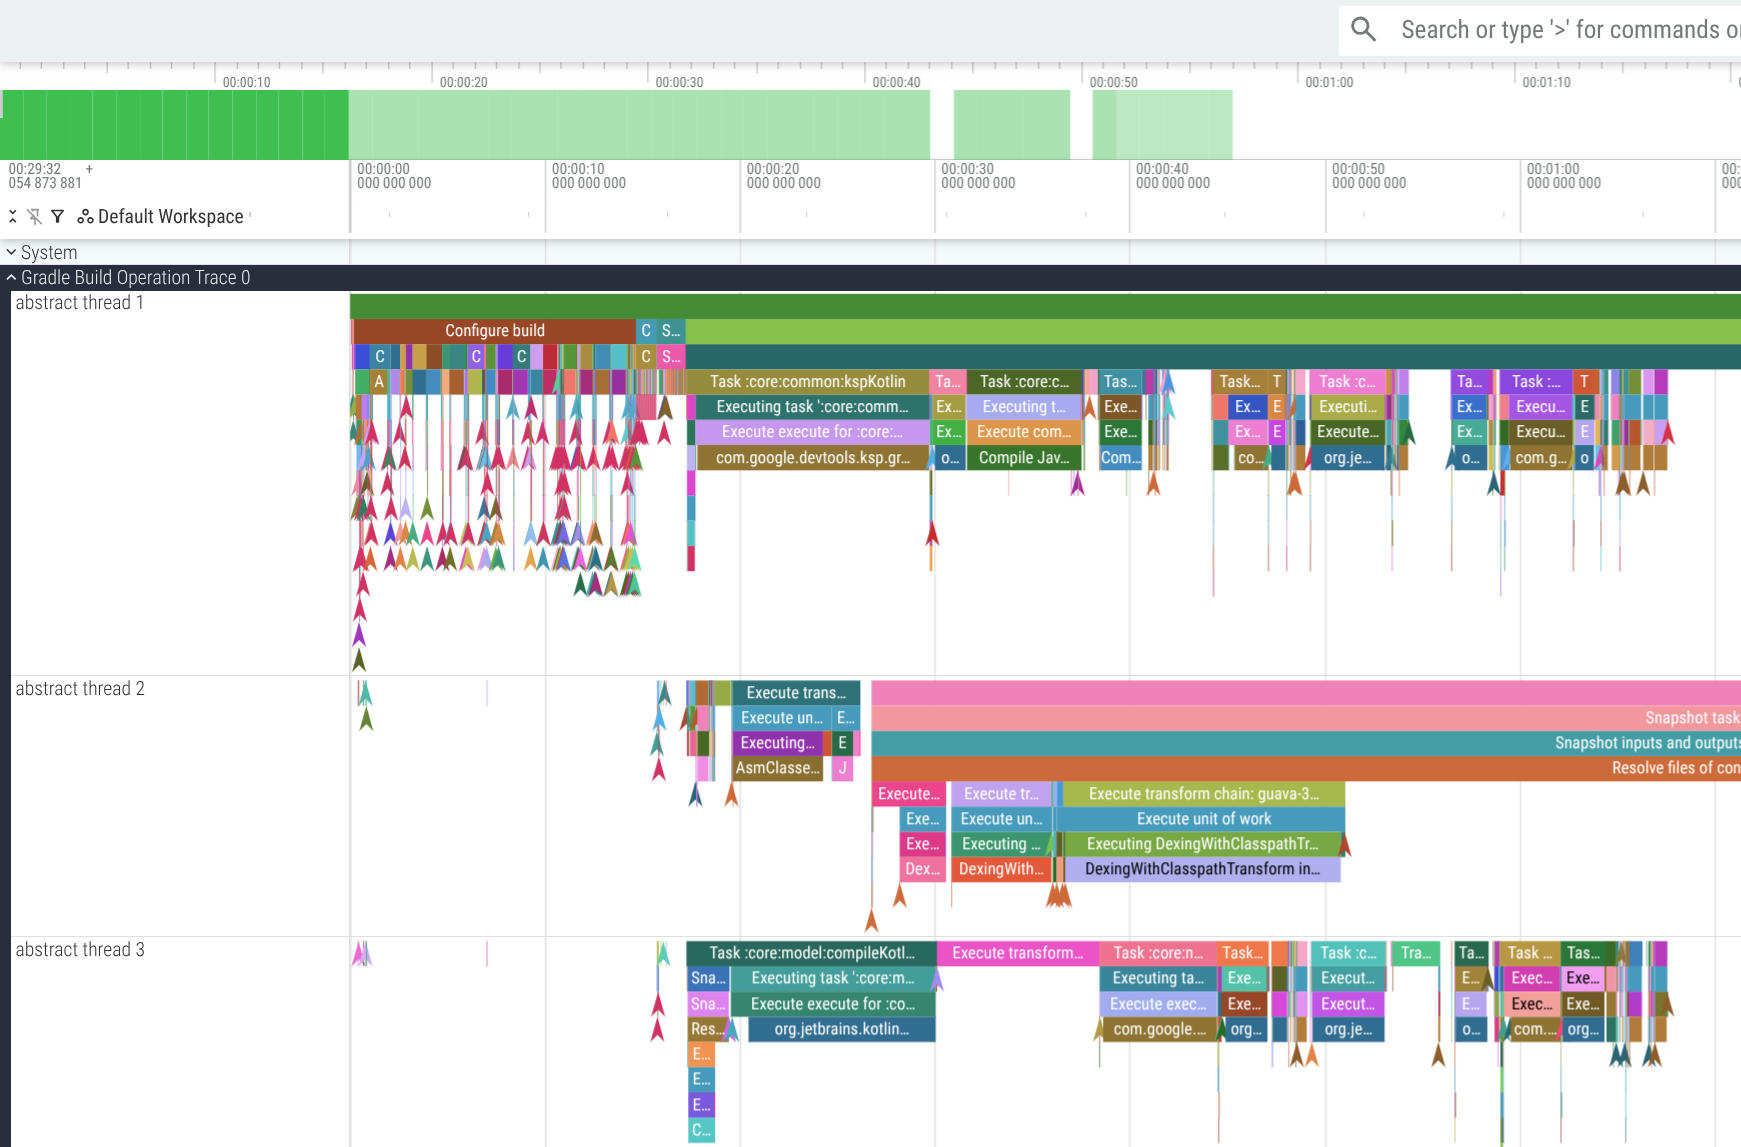
This gives you a highly detailed view of all the actions, operations, tasks, transforms, and other bits of work that
Gradle does during your build. With some time, you can spot inefficiencies in Gradle tool or your own build. For example,
as I was preparing this post I found that nowinandroid app build spends 86 seconds running a dex transform on
material-icons-extended-release.aar (androidx.compose.material:material-icons-extended-android:1.7.8).
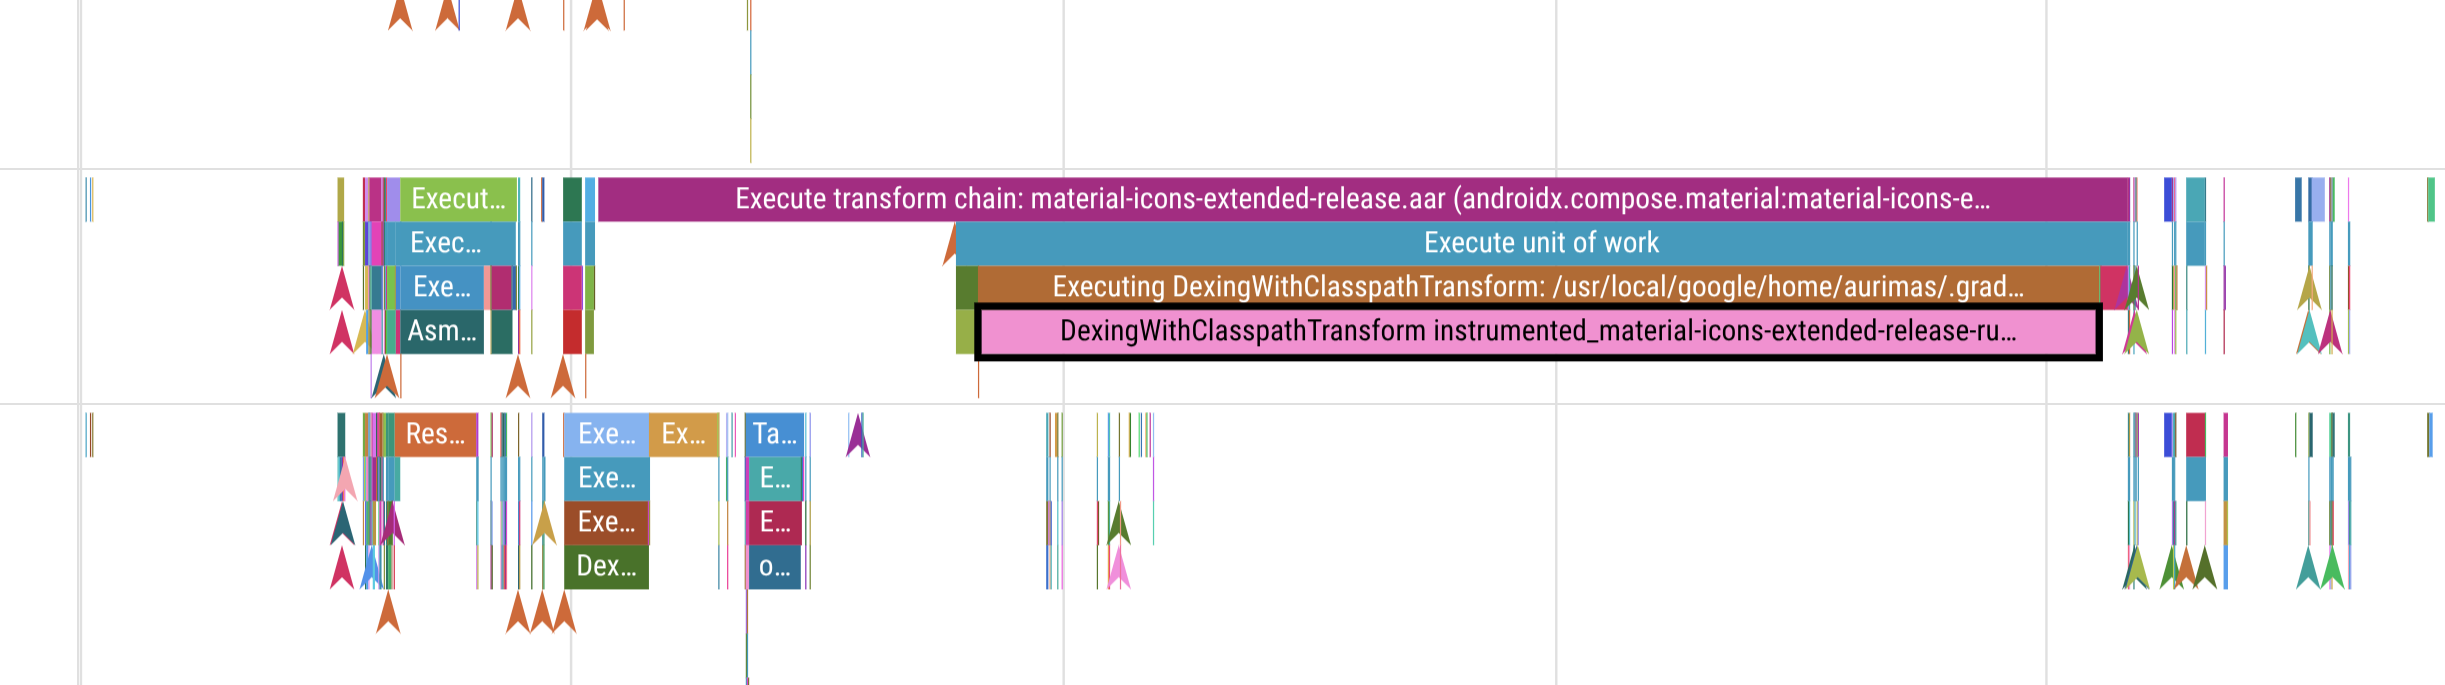
This is a giant library, but we only use 18 icons out of it, and it makes the build drastically slower every time transform cache is invalidated. A consideration might be to copy relevant icons and potentially drop this dependency.
Happy spelunking!