Unreasonable Configuration - What is a Normal Amount of Gradle Configuration Time?
It is very difficult to fix something if you don’t know what a normal behavior looks like. Through my conversations at DroidCon London this year I realized that most Gradle user do not know how long a well-maintained Gradle build configuration phase time with a configuration cache miss should be. This post will discuss how to build that intuition and validate it for your build.
We want to focus on the configuration phase, so the best way to do that is to use something along the lines of:
rm -fr .gradle/configuration-cache/
./gradlew build --dry-run
The first command deletes configuration caches entries from the project’s .gradle directory. This is the directory
where Gradle stores the entries from the previous runs of Gradle for this project. Note, this .gradle is not the same
as GRADLE_USER_HOME that is in ~/.gradle by default.
The second command runs Gradle in a dry-mode which covers the initialization and configuration phases, but skips the task execution. This is really handy for us trying to measure configuration phase.
Given this, you could run these two commands in a loop a dozen of times, drop the results from the initial few runs, and
get yourself a measurement of how long does it take to get the executing of tasks in your build. However, this is quite
tedious, so instead, we can use gradle-profiler tool to help us. You can
skim through the README.md to familiarize with all the options.
Create a validate.scenarios file with the following content:
default-scenarios = ["build_dry_run"]
build_dry_run {
    title = "Build dry run"
    tasks = ["build"]
    gradle-args = ["--dry-run"]
    clear-configuration-cache-state-before = BUILD
}
This represents the same two commands we used when running Gradle manually. clear-configuration-cache-state-before
causes Gradle profiler to delete .gradle/configuration-cache/.
For example, if I want to benchmark Androidify configuration phase, we can run:
./build/install/gradle-profiler/bin/gradle-profiler \
    --benchmark --project-dir ~/Code/androidify/ \
    --scenario-file validate.scenarios
This will generate a report that looks like:
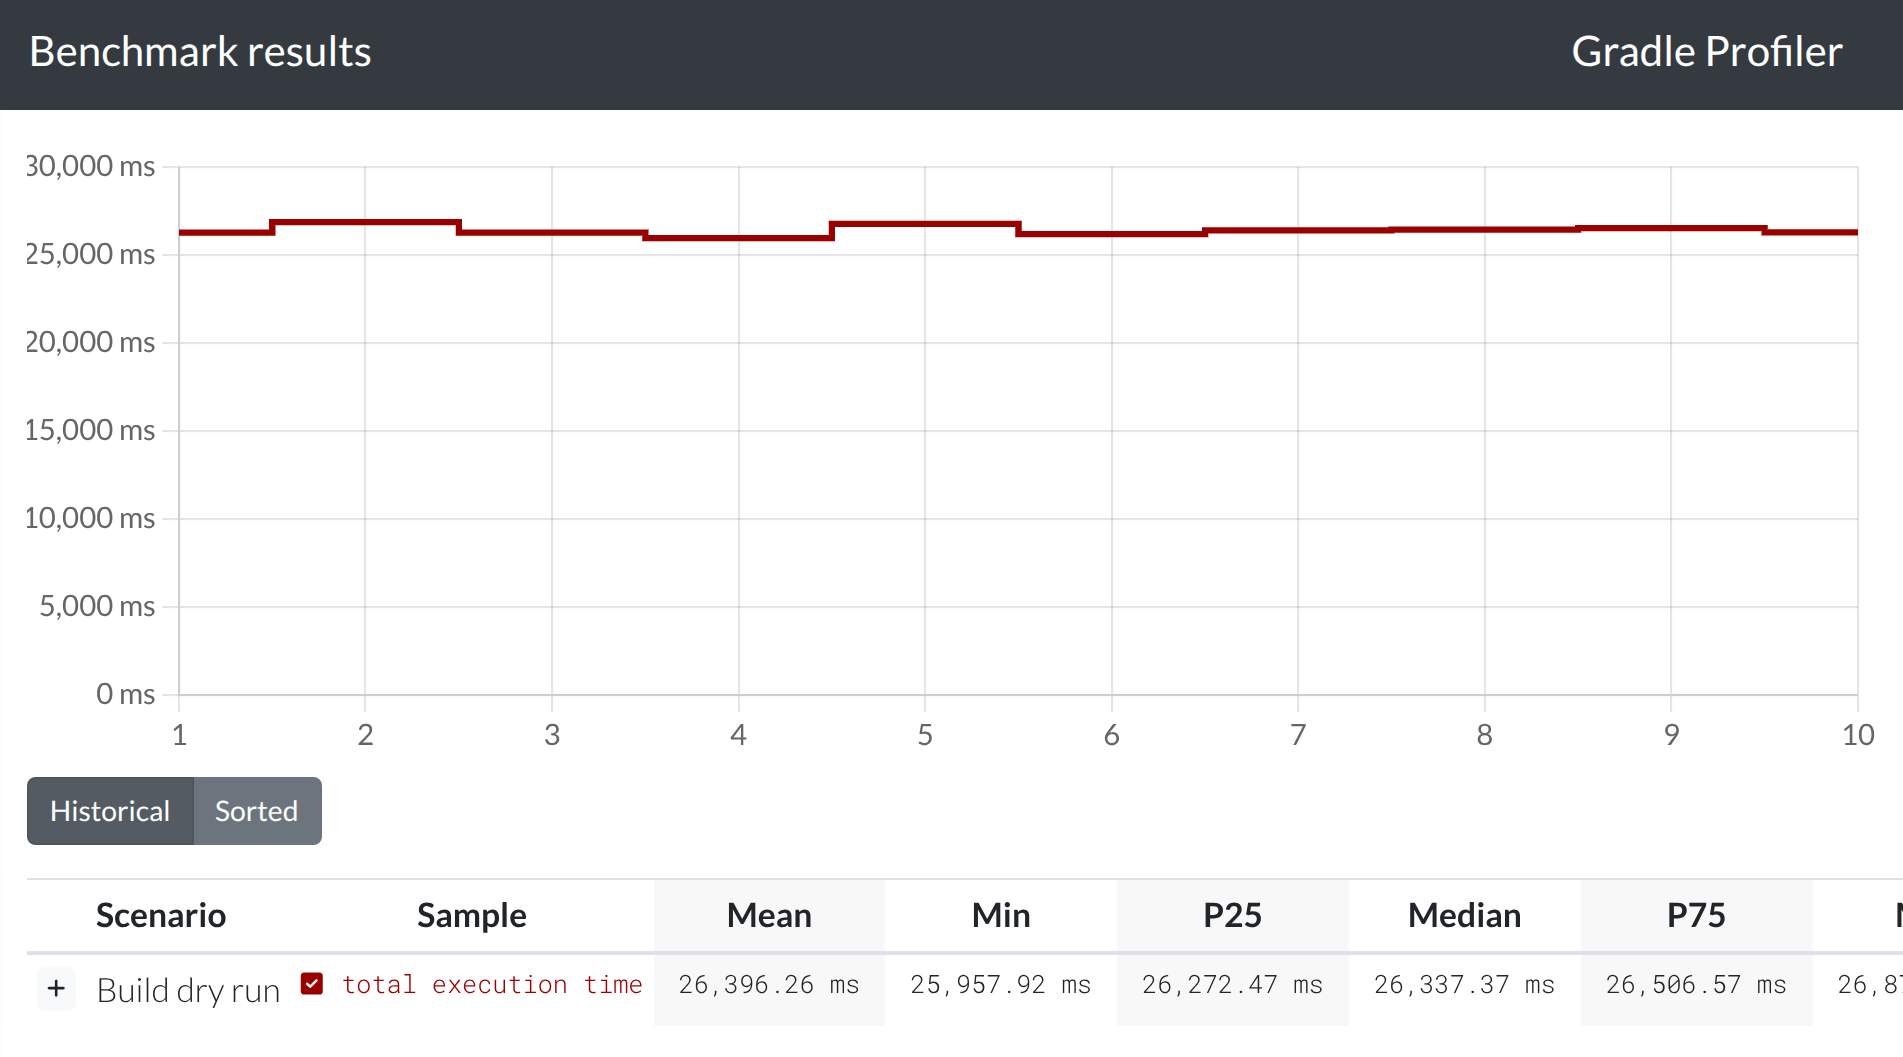
How do we know if 26 seconds is a reasonable amount of time? Gradle has no guidance about this in their documentation, so many folks just assume whatever time it takes, that’s how long it should be.
Here is my personal rule of thumb: if it takes more than 100ms per subproject you are likely doing more work than necessary on a modern hardware device (e.g. Macbook with Apple Silicon SoC).
Configuration phase is largely a serial process (note, this will change when Gradle Isolated Projects feature is launched).
Therefore, the performance bottleneck is largely the single-core CPU performance. This phase should also be quite
lightweight if all plugins follow task configuration avoidance
and defer work to the execution phase.
Going back to androidify example, this project has 19 subprojects (can be checked with ./gradlew projects), so the
expected configuration time is about ~2 seconds, but we have 26 seconds. That means this build’s configuration time is
one order of magnitude away from being within a reasonable range.
Using Profiling - The Good Kind post, the first thing that jumped
out was the overhead from using com.diffplug.spotless Gradle plugin.
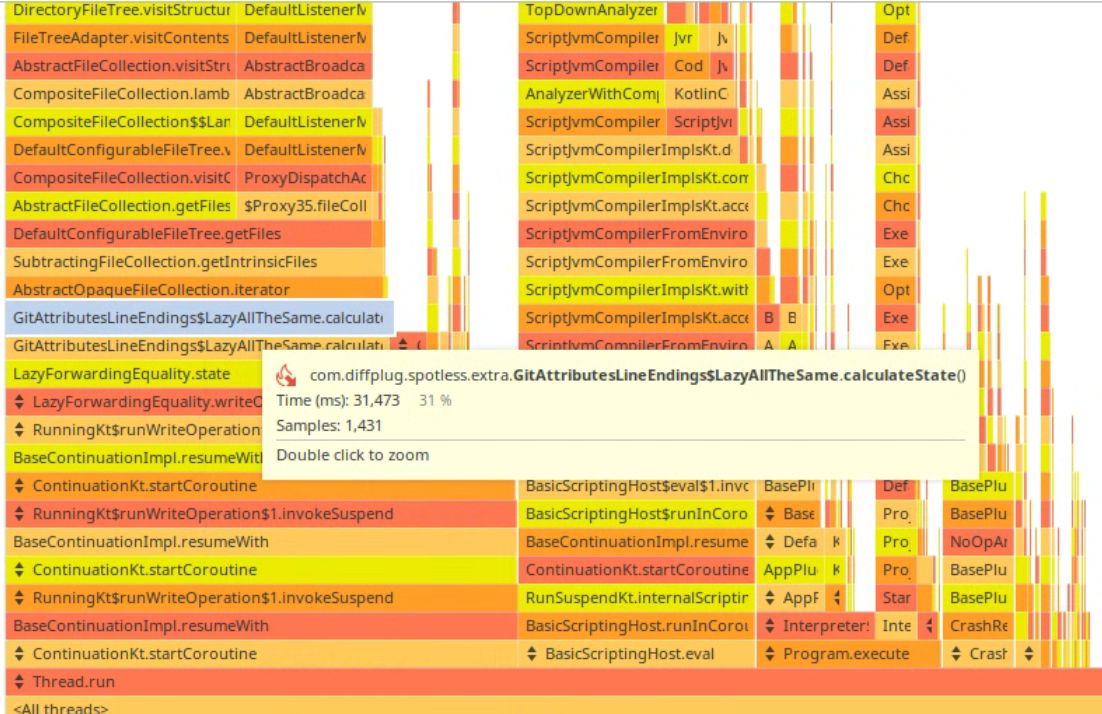
(Note, the times here are not comparable to the benchmark times because we are profiling)
We can see that LazyAllTheSame does file validation during the Gradle configuration phase, instead of during task
execution.
Simply removing com.diffplug.spotless from root build.gradle.kts and rerunning the Gradle profiler we get the
following:
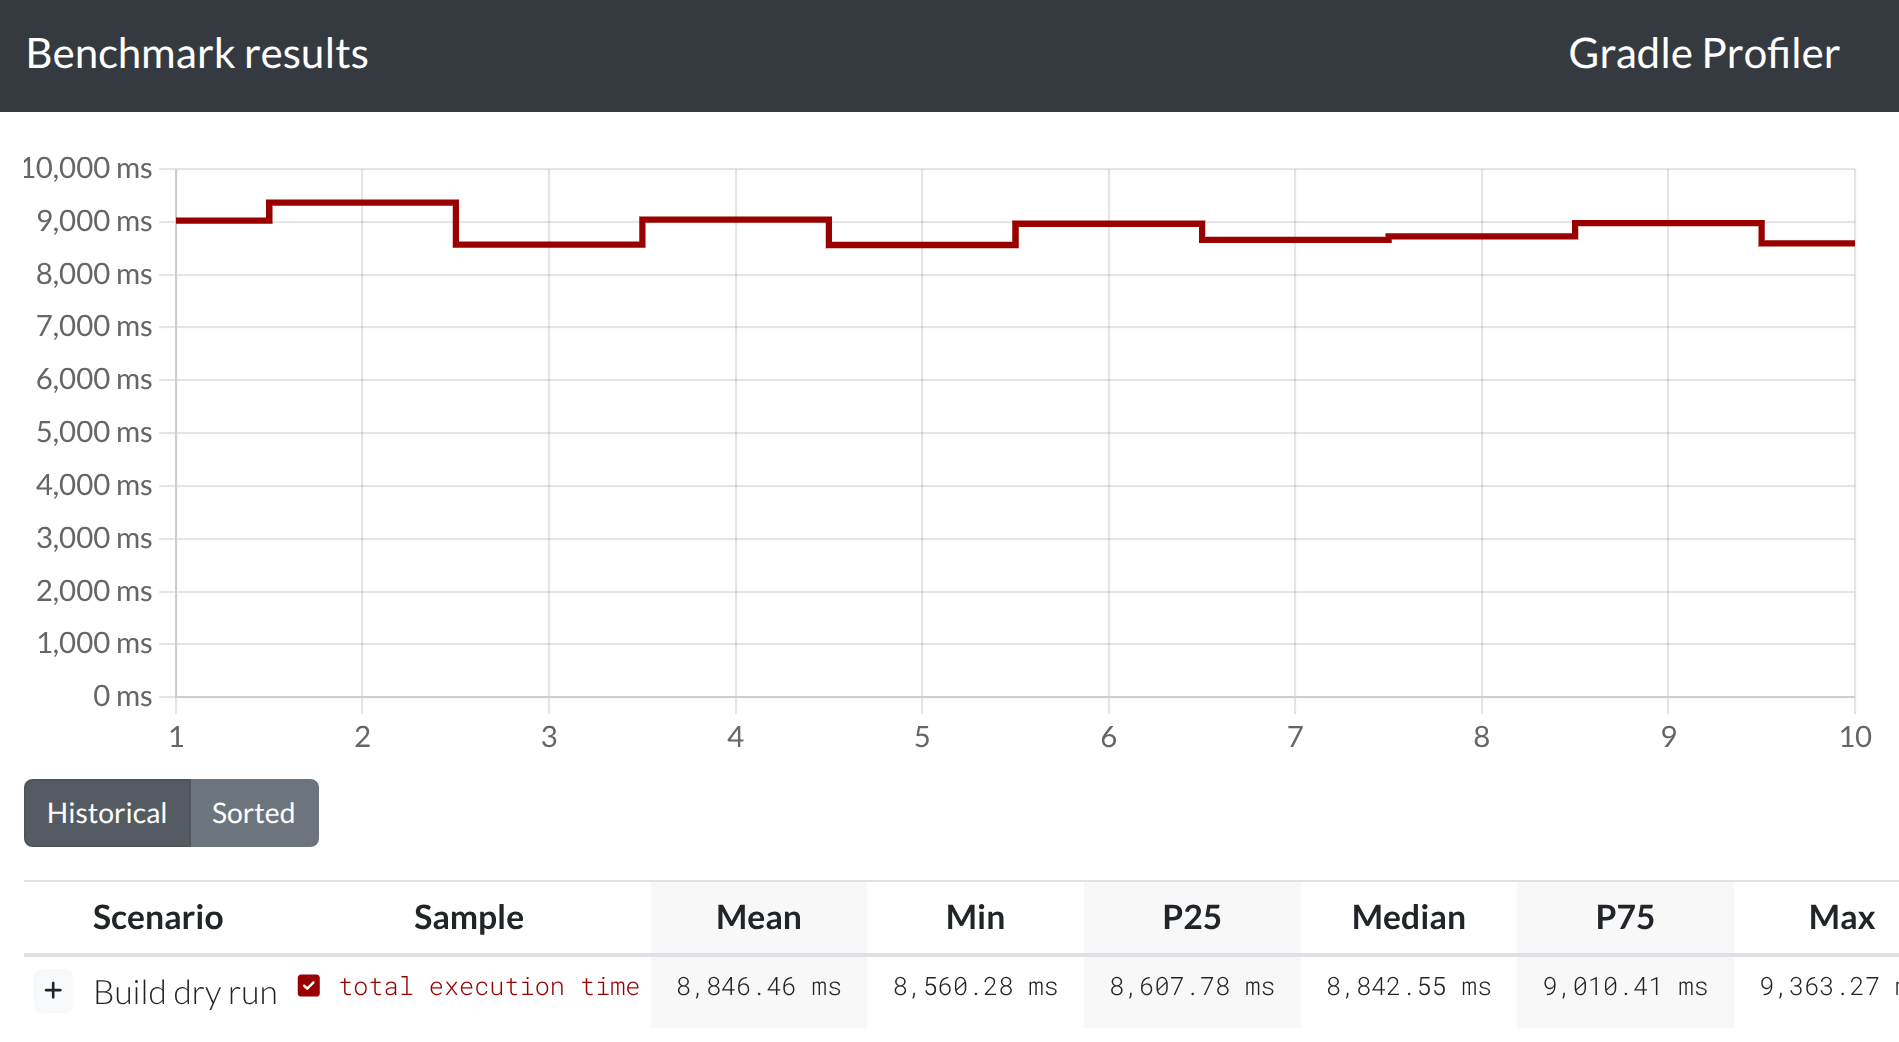
A removal of a single plugin makes our configuration go from 26 to 9 seconds. Even with this change, we are about 4.5x away from expected performance of ~2 seconds and getting there would require further investigation.